
| 일 | 월 | 화 | 수 | 목 | 금 | 토 |
|---|---|---|---|---|---|---|
| 1 | 2 | 3 | 4 | 5 | ||
| 6 | 7 | 8 | 9 | 10 | 11 | 12 |
| 13 | 14 | 15 | 16 | 17 | 18 | 19 |
| 20 | 21 | 22 | 23 | 24 | 25 | 26 |
| 27 | 28 | 29 | 30 | 31 |
- XGBoost
- classification
- 코너 검출
- Image Processing
- Ai
- Random Forest
- 가우시안 필터
- ai competition
- feature matching
- decision tree
- random forest tree
- Computer Vision
- 컴퓨터비전
- spaceship titanic
- data science
- 인공지능대회
- 이미지 처리
- 데이터사이언스
- 캐글
- feature descriptor
- kaggle titanic
- blob detection
- Machine Learning
- corner detection
- 인공지능
- difference of gaussian
- harris corner detection
- 해리스 코너
- kaggle
- 머신러닝
- Today
- Total
이것저것
[Kaggle] Titanic - Machine Learning from Disaster 본문
Dataset
import numpy as np # linear algebra
import pandas as pd # data processing, CSV file I/O (e.g. pd.read_csv)

import os
for dirname, _, filenames in os.walk('/kaggle/input'):
    for filename in filenames:
        print(os.path.join(dirname, filename))
Kaggle itself has a directory /kaggle/input and the train and test dataset are included in this folder. Now opening up the train.csv file
train_data = pd.read_csv("/kaggle/input/titanic/train.csv")
train_data.head()

It seems like PassengerID identifies a passenger, survived identifies if the passenger survived or not, and other information regarding the passengers. Our goal is to learn the pattern of survival in this data. Now let's open up the test dataset.
test_data = pd.read_csv("/kaggle/input/titanic/test.csv")
test_data.head()
It can be seen that this dataset does not contain 'survived' column. By first analyzing the relationship between passenger information and survival, we can apply the model to the test data and check the performance.
Training data analysis
Looking at the train.csv file, it can be seen that all of the female passengers are survived. Let's check the correlation between the gender and the survival.
It is clear that the male passengers died more than female passengers. If we assume only male passengers died and female passengers survived, we can run the code below.
women = train_data.loc[train_data.Sex == 'female']["Survived"]
rate_women = sum(women)/len(women)

print("% of women who survived:", rate_women)
The result gives 75% accuracy. This is not a bad approach, but the criteria itself is not appropriate since there still exists male individuals who survived. Let's take a look at the relationship between other passenger information and survival indicator.
It seems like passengers sitting in the 3rd class cabin died more, but still we cannot predict survival with just individual features. That means we have to take multiple features into account for predicting the survival, and many ML/DL algorithm performs this. One of the method is Random Forest Classifier.
Decision Tree Learning
Random Forest Classifier is a binary classification algorithm. Before discussing random forest classifier, we firstly have to think about an algorithm called decision tree learning.
Decision tree learning is a subset of supervised learning that utilizes binary tree with certain classification criteria in each node. Refer to the diagram below.
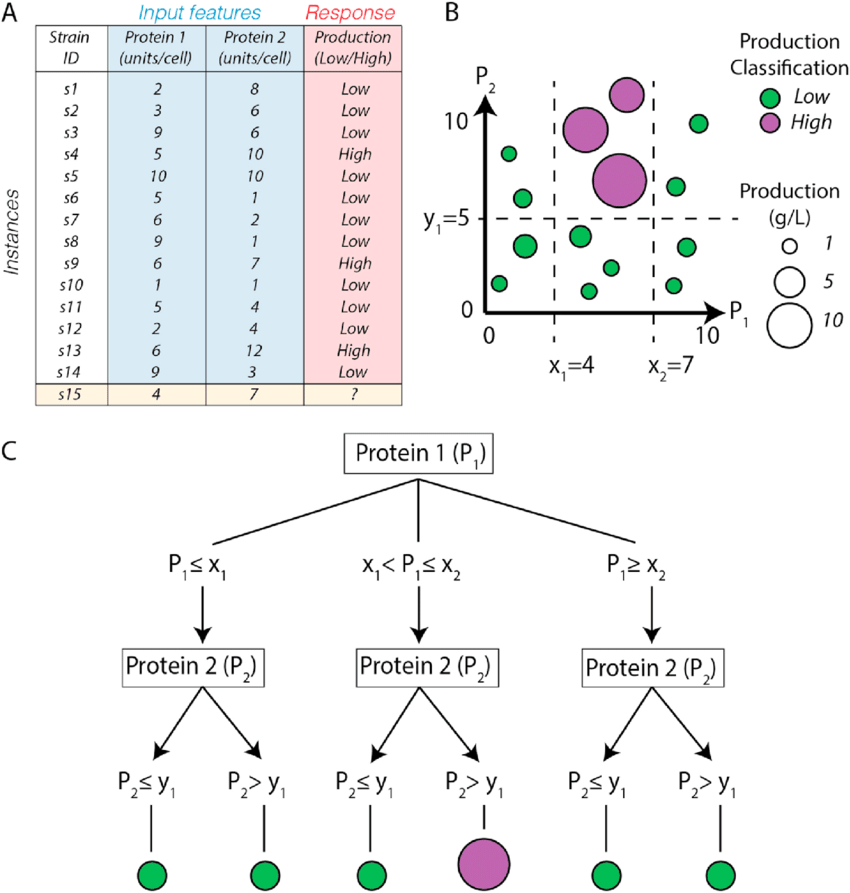
The leaf node of the decision tree represents the binary outcome and the nodes other than the leaf node represents decision criteria. If a new data point has to be classified, it passes through the nodes and the resulting leaf node becomes the classification outcome. To train the model, we have to select the best criteria for each node. Therefore the goal of training is to find the criteria that maximizes information gain (IG), which is our objective function. The best classification criterion for a single node results in data points with single class label at the leaf node, whereas the worst classification criterion results in completely mixed class labels at the leaf node. Therefore the model's loss can be calculated using cross-entropy loss function defined as the equation below.
H=−∑ip(i)logp(i)
Using the entropy calculated, we can compute information gain
IG=Hparent−∑wiHchild
where wi represents the proportion of the classified points in the child node i. The training algorithm calculates IG for all possible criteria and chooses the criteria with maximum information gain.
Random Forest Classifier
In fact, decision tree learning is very sensitive to the training dataset. If a single entry of the training data is modified, the resulting tree becomes signficantly different than the original and may cause overfitting. One of the way of resolving this issue is using random forest classifier.
Random forest classifier chooses datapoints randomly from the training dataset (called bootstrapping) and chooses random features (called feature selection). Note that single datapoint can be chosen multiple times while bootstrapping. In the randomly selected datapoint and features, single decision tree is trained. The algorithm repeats bootstrapping and feature selection multiple times, constructing multiple trained decision trees.
In the testing phase, a single data point passes through multiple trees generated in the training phase, resulting in multiple classification results for each tree. The majority vote of the classification wins. Refer to the diagram below.

By choosing the datapoints randomly multiple times, it can reduce training sensitivity to training dataset. Also, selecting the features randomly reduces feature dependency of the classification outcome resulting in the reduction in variance.
Classification on Titanic data can be done by running the code below.
from sklearn.ensemble import RandomForestClassifier

y = train_data["Survived"]

features = ["Pclass", "Sex", "SibSp", "Parch"]
X = pd.get_dummies(train_data[features])
X_test = pd.get_dummies(test_data[features])

model = RandomForestClassifier(n_estimators=100, max_depth=5, random_state=1)
model.fit(X, y)
predictions = model.predict(X_test)

output = pd.DataFrame({'PassengerId': test_data.PassengerId, 'Survived': predictions})
output.to_csv('submission.csv', index=False)
The accuracy of classification is 77.5%. Since it has 4 features, the classification cannot be easily visualized on a screen. Therefore performing dimensionality reduction using PCA to 2 dimensional and visualizing gives the figure below.

The classification result is not perfect, but shows fairly accurate predictions on the test dataset.
References
https://medium.com/machine-learning-bites/machine-learning-decision-tree-classifier-9eb67cad263e
Machine Learning: Decision Tree Classifier
A decision tree classifier lets you make non-linear decisions, using simple linear questions.
medium.com
'Kaggle' 카테고리의 다른 글
| [Kaggle] Backpack Prediction Challenge with XGBoost (2) | 2025.02.06 |
|---|---|
| [Kaggle] Spaceship Titanic (2) | 2025.01.18 |

